The fundamental factor driving the retirement crisis is the increasing cost of an “adequate” retirement. Retirement is, just like housing or food, a necessity. We are all going to get to the point where we can’t work anymore. And we must somehow provide for ourselves—as individuals and as a society—for that period of old age in which we’re no longer earning an income.
 How much has the cost of retirement gone up? To answer that question, we looked at one relatively intuitive metric: what percentage of pay would a worker have to save to finance an adequate retirement?
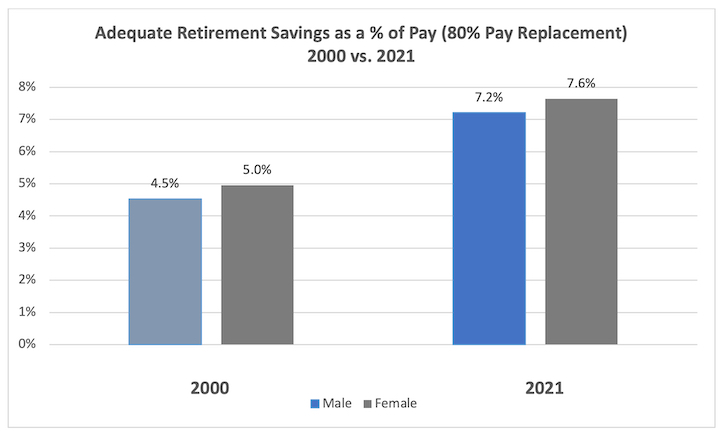
The chart below maps that cost over the period 1990-2021 for an “average” worker. Bottom line: a middle-class (female) wage-earner retiring in the year 2000 (final pay = $40,217) would have had to have saved, over her career, 5.0% of pay to finance an 80% pay replacement in retirement. A (female) middle-class wage earner retiring in 2021 (final pay = $69,245) would have had to save 7.6% of her pay. That is a 54% increase in the cost of retirement for this worker, requiring an additional 2.6% of pay to be saved for retirement, year in and year out, over a 40-year career. (To be clear, the only difference between final pay here—$40,217 in 2000 and $69,245 in 2021—is 21 years of wage inflation.)
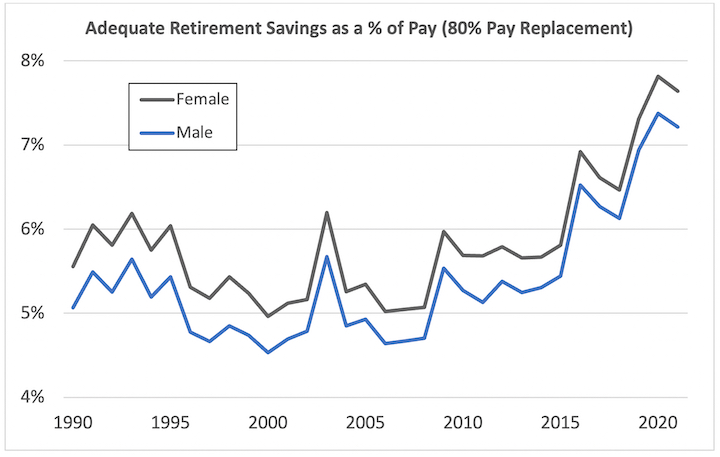
Here's the chart showing this trend for all years back to 1990:
 Thinking About the Cost of Retirement
Several factors have conspired to produce the sharp increase in the cost of financing retirement seen this century:
1. The higher cost of annuities, due to increased life expectancy and declining interest rates
2. Reduced pay replacement under Social Security
3. The effect of capital markets on retirement asset accumulation
In our previous article, we looked at the first two factors by calculating how much a worker would need to accumulate in retirement savings at age 65 in order to replace 80% of final pay in combination with Social Security. In this article, we look at the “accumulation phase” for each of our cohorts in order to understand how capital markets and career pay patterns affect what percent of pay the worker needs to save in order to reach the adequate retirement goal.
The Cost of Income and Market Performance
Let’s unpack the interaction of factors 1 and 3, the cost of retirement income and the performance of the capital markets during the accumulation phase.
To a large extent, the cost of retirement income is a function of interest rates. That is, the effect of the decline in interest rates is significantly greater than the effect of the increase in longevity/average life.
The performance of the capital markets is (with respect to bonds) also a function of interest rates. When interest rates go down, bond values go up (and vice versa). This revaluation, to reflect a change in interest rates, will also (generally and all else being equal) affect equity values. When interest rates go down, stock values (assuming no change in earnings projections) go up—that is, generally, when interest rates go down, the price-to-earning (P/E) ratio goes up. And vice versa.
All of these effects simply represent mathematical adjustments for the cost of producing future income. That is, when interest rates go down, the value/cost of income in the future goes up. And that goes for interest on bonds and earnings on equities.
But with respect to equities, there is another factor: real productivity/earnings growth. Thus, it is possible (and it has happened) that interest rates may go up at the same time that earnings (or earnings expectations) go up. In this situation, the cost of income in the future goes down, but the value of your equity holding (nevertheless) goes up—because you expect the future to be more productive (of income). That explains the decrease in the cost of retirement that we see in the chart above from the early-1990s through the early-2000s.
These two factors—interest rates and productivity growth—map out to a quadrant of results:
| Higher interest rates + higher capital market returns = A net reduction in the cost of retirement income | Higher interest rates + higher capital market returns = A net reduction in the cost of retirement income |
| Lower interest rates + higher (capital market) returns = Offsetting effects on the cost of retirement income | Lower interest rates + lower (capital market) returns = A net increase in the cost of retirement income |
That’s the hard part of our calculation—understanding how changes in the cost of retirement income (annuity purchase rates) have interacted with changes in asset values over the period we have considered. The product of those two factors must be then netted against how much of a worker’s retirement income target will be met by Social Security.
And the end product of those calculations is the “adequate” savings rate we have calculated.
What Changed?
What has changed over this period to drive up the cost of retirement savings? Increasing longevity and reduced pay replacement from Social Security have had something to do with it. But, to repeat, the (overwhelming) factor driving this increase in the cost of retirement is the long-run decline in interest rates, which, as we discussed in our last column, drove up the cost of retirement income (specifically, the cost of annuity income at age 65) by 63% between 2000 and 2021. [Note that the high rate of pay increase for workers through 2000 made the cost of retirement (marginally) more expensive—that factor accounts for the fact that the subsequent net increase in the cost of retirement (2000 vs. 2021) was only 54%, not 63%.]
To connect the dots—the decline in interest rates (and the concomitant increase in the cost of annuity income) has not been offset by an increase in earnings/productivity.
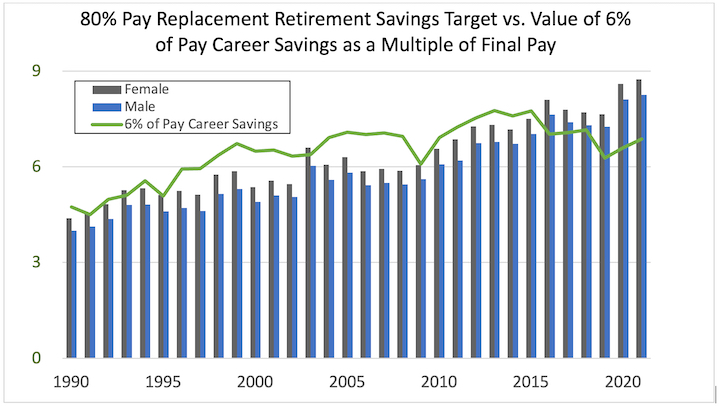
The following chart shows what a savings rate of 6% of pay bought (as a percent of final pay) vs. the cost of an 80% of final pay benefit, over the period 1990-2021.
 Long story short: The future has gotten more expensive. Before 2015, a savings rate of 6% of pay was generally enough for these workers to generate an “adequate” retirement income. Beginning in 2016, the price of retirement went up.
Understanding the Moving Parts in the Retirement Savings Calculation
Wages: Our middle-class workers begin work earning median income and receive pay raises over a 40-year career that lift them to 200% of median income at retirement.
The retirement income target: We’ve used 80% of final pay (minus whatever is provided by Social Security). Some may argue that number is too high. As a general matter—if we ignore Social Security—choosing a lower target would not change the slope of this line/the percentage increase in cost, just the base number.
The amount of the target covered by Social Security: Social Security provides a “progressive” benefit—the percent of pay replaced by Social Security is higher at lower incomes. As a general matter, that means that workers retiring at a final pay level below our “middle-class” worker (that is, with a final pay below 200% of median income) will have more of their retirement income target met by Social Security and thus will have to save less. And, correspondingly, workers retiring at a final pay level above our “middle-class” worker will have less of their retirement income target met by Social Security and thus will have to save more.
As wages go down or up, the slope of the line (the percentage increase in the cost of retirement) will be less steep or more steep, but the effect here is not as significant. And, in any case, at all pay levels, the cost of retirement has increased.
The performance of the capital markets: We use a “target date” approach to the portfolio, starting out (in Year 1) with a 100% allocation to equities and “glide path,” reducing this percentage to 20% equities/80% bonds portfolio at retirement.
The cost of retirement income: As discussed in our last article, we use published retail annuity purchase rates from a major carrier to determine the cost of retirement income.
Making Sense of These Numbers
There are (no doubt) many different stories that could be told about these numbers. Here is ours.
It is axiomatic that the “burden” of retirement is easiest to bear when the age pyramid is “right side up”—when the ratio of retirees to working age adults is weighted toward working-age adults. That was the situation—indeed, more so than perhaps any prior time in history—during the period from the mid-1990s to the mid-2000s, when the (massive) Baby Boom generation was at peak productivity.
Since then, as is being highlighted increasing in the press, we have seen declining birth rates. The double whammy of a historically large cohort entering retirement and subsequent historically lower birth rates has driven up the cost of retirement, in the same way that increasing demand and decreasing supply drive up the cost of any good or service.
These factors play out in the capital markets as declining interest rates, declining asset returns, and higher retirement income costs. That is, regarding those two fundamental factors we noted at the top: from 1990 until 2015, the cost of retirement income was (relatively) low and the performance of capital markets was (relatively) high. That situation has now reversed—the cost of annuity income is up, and returns are down.
What’s Next?
What are the implications of the foregoing analysis for today’s workers—for someone retiring, say, in 2030 or 2040? Right now (in July 2022)—relative to 2021—interest rates are up (and annuity purchase rates are down). And the capital markets are (generally) negative. But what about the longer run? In our next article we will do some forecasting—when the retirement crisis will really begin to bite.
Michael P. Barry is a senior consultant at October Three and President of O3 Plan Advisory Services LLC, which provides retirement plan regulatory analysis targeted at plan sponsors and those who provide services to them.
Brian Donohue is a member of October Three’s actuarial consulting team and part of the senior leadership for October Three.
Opinions expressed are those of the authors, and do not necessarily reflect the views of ASPPA or its members.
- Log in to post comments
